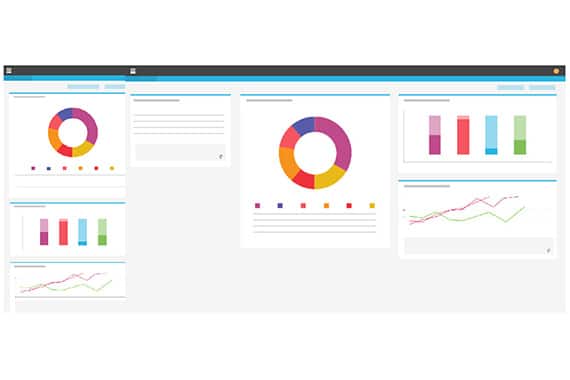
A classic WMS or TMS solution offers external reporting tools, either via a remote dashboard or via a third-party Business Intelligence (BI) application. Using the external reporting tool, users will create their own key performance indicators (KPIs) based on data taken from the WMS or the TMS.
The main disadvantage of this solution is that the user must juggle with two applications: the reporting tool to monitor the KPIs, and the WMS or TMS for access to the relevant data. Tracking an indicator and being notified in case of an irregularity is one thing, but knowing how to analyze the cause of a problem quickly is another. To do that, there is no solution other than to use the trade screens in the WMS or TMS.
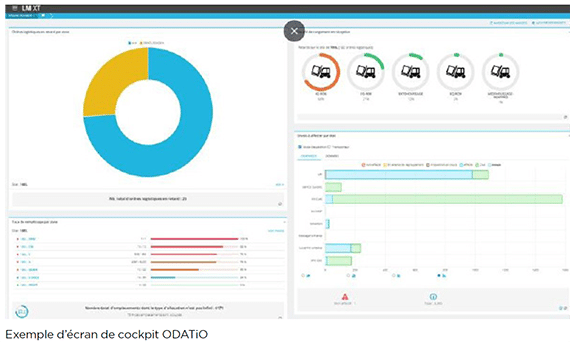
Based on this observation, we decided to equip our ODATiO solution with much simpler and faster data access via a customizable control cockpit.
This cockpit lets you supervise all activities, both warehouse and transport. It consists of a set of widgets, all displaying some information and KPIs. Each information zone (data from a graph or table) is clickable so that, within the same application, you can go directly into a trade interface giving all the detailed data needed for an analysis of the critical points and indicating the urgent actions to be applied.
As a user, you see only the KPIs that are relevant to your own area of responsibility. You can then zoom in on them and take any necessary actions. This makes operational control more precise, responsive, and efficient.


